In this lab, you will write a program that uses a pre-written FileReader class to read a large amount of integer data from a file. Once read, you'll place the data into an array, plot it, and compute various metrics on the data.
Assume that this data is a heartrate history acquired by an exercise machine (each value represents heartbeats/second). You are to
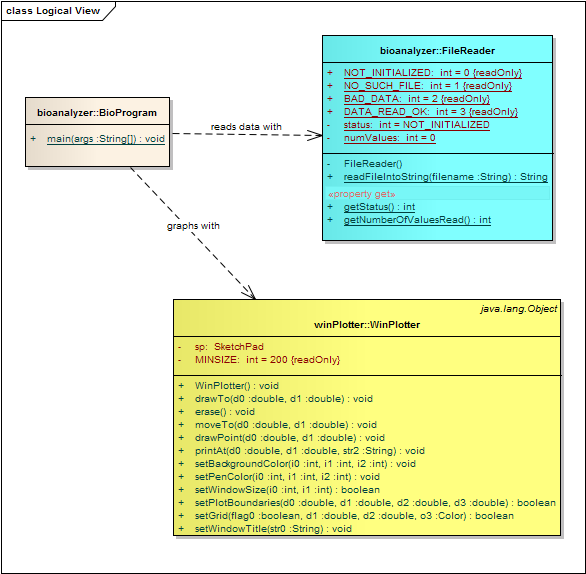
Your program will consist of several classes; you have to write only one of them. The BioProgram class (to be put in the msoe.se1011.<yourname> package) that you will write contains the main() method and handles all dialogs that get input from and presents output to the user.

When completed, your program should function according to the following sequence of steps, with substantially similar UI:
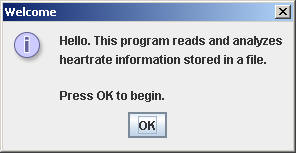
1) begin by posting a welcome dialog to the user (from
with your BioProgram class):

2) your program should prompt the user for the file containing heartrate data, such as data.txt
:
3) Prompt the user for the lower range of the target (normal) heartrate zone:

4) Prompt the user for the upper range of the target
(normal) heartrate zone:

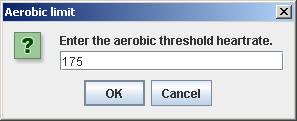
5) Prompt the user for the aerobic threshold heartrate:

After each of steps 3, 4, and 5, you
should make sure that the input values for the various heartrates are valid;
that is, not null, non-blank, and non-negative. As in previous labs, you
need to use conditional logic to check this, and when detected, inform the user
of the error and exit (if null, meaning Cancel was pressed) or repeat the prompt
for the value.
Use the
supplied FileReader.java class (do not modify this
code!) to read the heartrate data from a specified file Process the information
(calculate average heartrate etc) after you store the data into an array of
int's. You
can download this Example.java program that shows how to
use the FileReader class to read data from a specified file.
Make
sure you use the FileReader's getStatus() method after reading the file. If you don't get the
DATA_READ_OK value back from getStatus(),
you should display an error message to the user rather than displaying a graph
in the WinPlotter window.
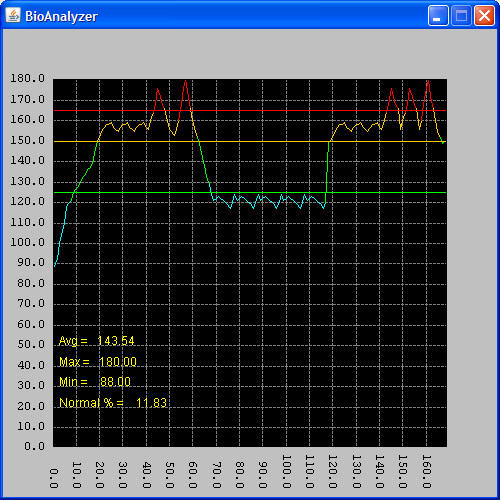
6) Generate a Color-coded graphical display of the data (you get the following
display if you use the supplied data file), including the summary of results as
shown (note that the values used for lower limit, upper limit, and aerobic
threshold were 125, 150, and 165, respectively).

Test your program and make certain that it works correctly. The format of the file containing the heartrate information is very simple: it's just a text file where each line contains a single heartrate value. You can easily create your own files that allow you to input known values such that you can verify the results of your computations. For example, with a file containing only 10 values (say between 20 and 50), you can easily hand-calculate the average of those values and percent of values between, say, 25 and 35.
Submit your assignment following these instructions:
Be sure to keep copies of all your java files, in case something gets lost.
Your grade will be based on the following criteria: