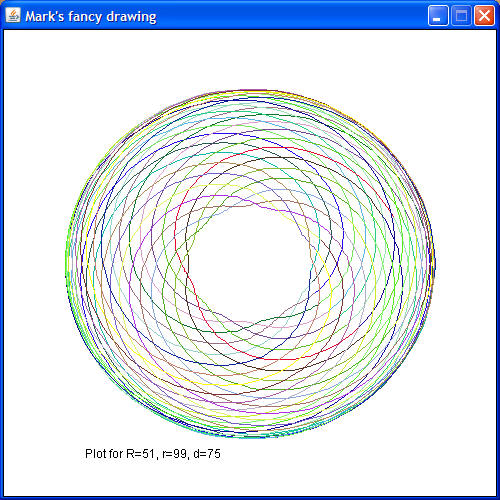
If you ever played with the Spirograph toy as a kid, you
are already familiar with the shapes it can draw, like so:
Your assignment is to write a Java application that draws similar shapes with the aid of the WinPlotter class that was written by me (this is an example of a user-written class that we'll be discussing soon in class).
The "shape" above is really a curve that mathematicians call an epitrochoid. The coordinates (x,y) of any point on the curve are given by the following parametric equations:
![]()
![]()
where R, r, and d are values that govern the overall shape of the curve. For a particular curve, you choose arbitrary values for R, r, and d (for example, 51, 99, and 75 for the curve shown above). You also choose a fixed value for n (100 in the curve above), which governs the "precision" of the curve. In the equations above, t is the independent (parametric) variable, meaning that x and y are both functions of t. Thus, as t varies, the values for x and y can be calculated for any point on the curve.
Your math professor would say that t varies continuously between negative infinity and positive infinity. Computers (and calculators), however, can only evaluate functions for discrete, finite values of the independent variable. Thus, you can only compute discrete values for x and y for each discrete value of t. For some range of values of t (for example, from 0 to 10000), you can compute 10001 values for x and y. To plot the curve, you connect the successive x,y points with straight lines. If the points are close together, the straight lines are very short, and you get a decent approximation to the "ideal" mathematical curve.
Your program must consist of a main class called Spirographer, in a package named msoe.se1011.<your msoe email name>
Declare a constant to represent n and initialize it to a value of 100. Unlike variables, constants have all UPPERCASE names and are usually declared at the top of a program - in fact, outside of any method. Declare your constant above the main() method but within the class braces. DO NOT use a hard-coded value for 100 anywhere else in your program; use this constant instead.
In your program's main() method, prompt the user to enter:
Your must request these values using the JOptionPane.showInputDialog method. Use 3 separate while or do-while loops to surround the entire sections of code that processes these inputs.
In all three sections, implement the logic that ensures that the inputs are not null, not empty, and within the specified range.
Once your program acquires and validates the input values, create an instance of the WinPlotter class. Then implement the following pseudocode to configure the drawing window:
Next, evaluate the equations above for x and y using a value of t=0. Use the moveTo() method of WinPlotter to move the "drawing pen" to these coordinates within the drawing window. Note: read the API documentation for the Math class to determine how to compute sines and cosines.
DO NOT use a hard-coded value for pi in your code. Instead, use the predefined value from the Math class.
Use the use a for-loop to iterate the parameter t from 1 to 10000. Within the loop, evaluate the equations for x and y. For each pair of computed values, use the drawTo() method of WinPlotter to draw a straight line to each successive coordinate. Change the pen color every 100 steps through the loop (hint: use the modulo operator to determine when to change pen color). Use the Math.random() method to generate a random value between 0 and 1, and then use the approach discussed in the textbook to scale that to a value between 0 and 255 - the values you supply to the setPenColor() method of WinPlotter.
Near the bottom of the drawing window, use the WinPlotter printAt() method to print a formatted message similar to: "Plot for R=51, r=99, d=75"
After the for-loop, prompt the user to run again by using the JOptionPane.showConfirmDialog, which produces the dialog below. If the user presses "Yes", repeat the entire program from the start (you'll have to surround everything with a while-loop).

Submit your assignment following these instructions:
Be sure to keep copies of all your java files, in case something gets lost.
Your grade will be based on the following criteria: