| develop beginning jQuery and Bootstrap development skills | |
| continue to develop HTML, CSS, and JavaScript development skills | |
| use Bootstrap to create a responsive HTML page | |
| use jQuery and selectors to access and modify the DOM | |
| define and implement jQuery-based event handlers, callbacks, and animations | |
| use the HTML <canvas> and and external charting library |
Recently, you entered the time it took to execute your CoinFlipper application into a web form (that we will revisit later in the course). Your entries were saved by this application in the form of a JavaScript array of objects.
Recall that in JavaScript, an object can be defined literally: let person =
{name:"roscoe", age:21};
In this case, the person object has properties that can be accessed as person.name
and person.age.
Recall also that in JavaScript, an array can be defined literally as well:
let charList = ["a", "b", "c"];
In this case, the charList array elements can be accessed individually as
charList[0], charList[1], etc.
Combining the two concepts, we can define a literal array of objects: let
people = [ {name:"roscoe", age:21}, {name:"rhonda", age:22} ];
We can access the first person's name as people[0].name, etc.
In a similar fashion, all of the information that you and your classmates
entered into the
web form were saved as an JavaScript array of individual entries (where each
entry is an object):
let results =
[
  {
     name: "roscoe",
     time: "300",
     ip: "155.92.64.28",
     sessionid: "735C083B4F51230A23A372CB5C7CB350"
  },

  {
     name: "rhonda",
     time: "201",
     ip: "155.92.72.241",
     sessionid: "D290A70372961ED573A9A6BB58B17265"
  },
  ...etc
];
In this assignment, you will write a web page that presents the CoinFlipper results in a table format as well as a graphical chart format, similar to what is shown below:
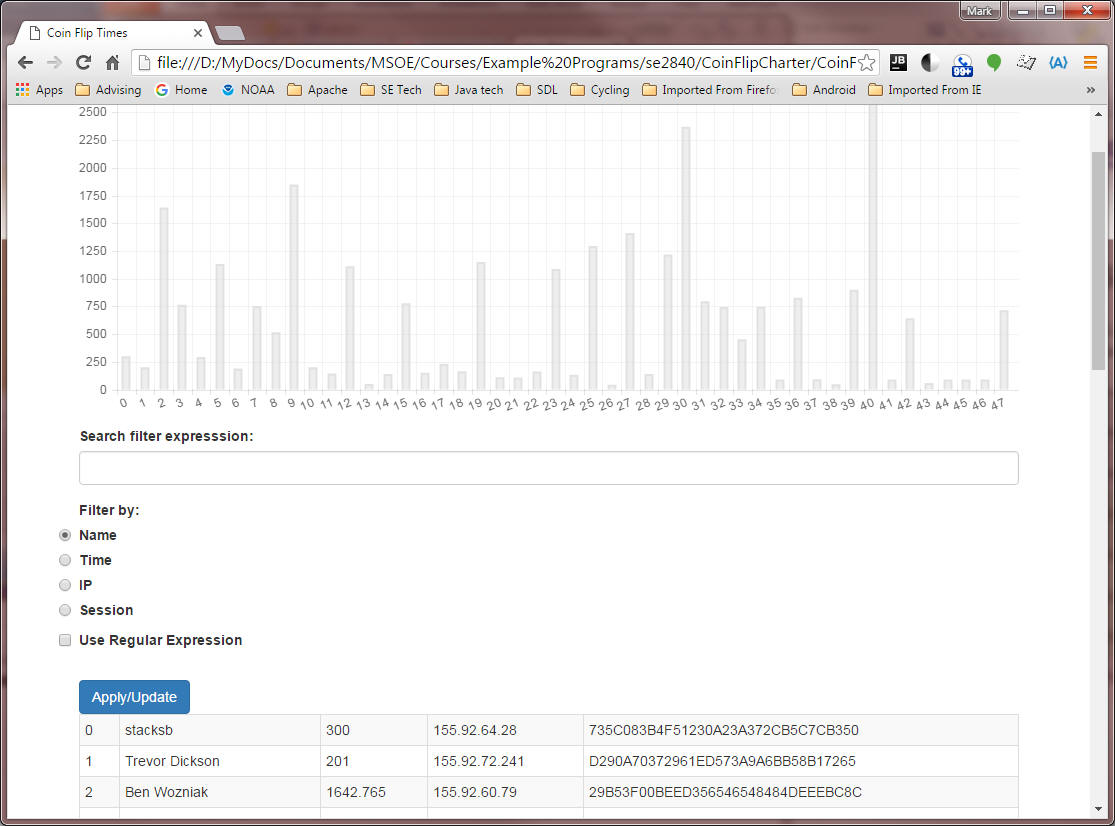
Note that the table must display the index of the entry in the first column. The index is just the position of the entry within the array.
The horizontal axis of the chart is simply this same index. The vertical axis is the time (also appearing in the third column of the table) corresponding to that index.
As shown below, your web page must also implement a search filter that, when applied, causes certain elements can be selectively displayed/hidden via jQuery:
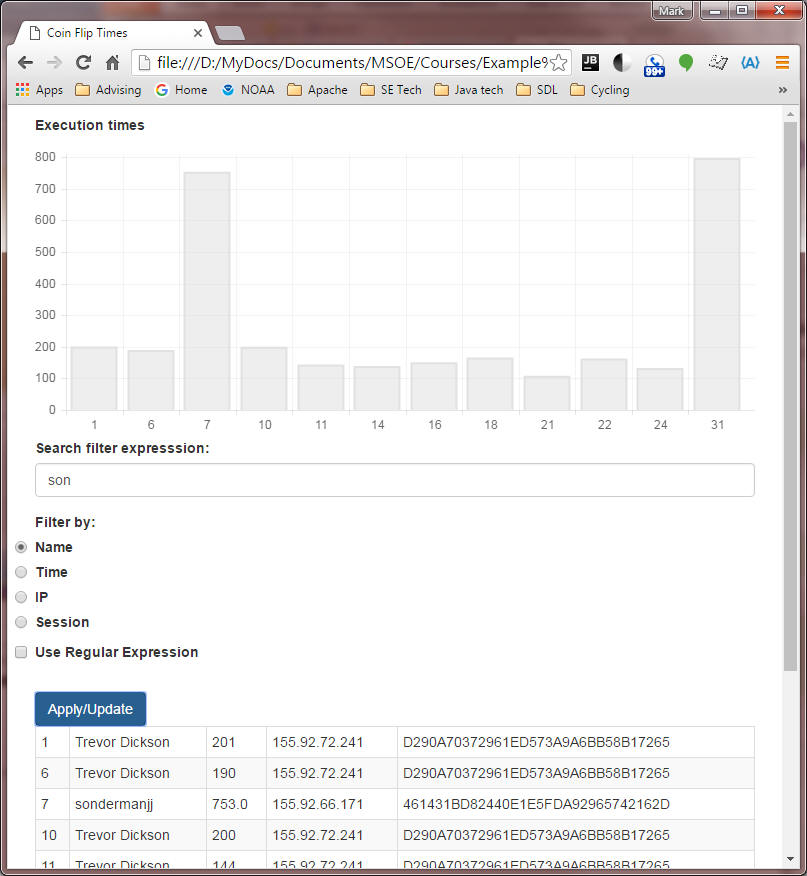
In the above filtered view, only name entries containing the string "son" are displayed in the table. Note that the original index numbers are retained, along with the table background coloring originally applied to the entire table. You must use jQuery hide() or fadeOut() methods to selectively hide rows of the table - don't just regenerate the table with fewer rows. Hint: you may want to assign each <td> element in a given column to a specific class in order to make jQuery selection easier.
The chart has been regenerated to include only the filtered entries.
This application has been started for you:
The html and js files contain numerous comments that should help you to complete the implementation. Use the sample code on the course webpage (CanvasDemo.html, CanvasDemo.js, etc) as a starting point.
The page must be responsive (so that everything resizes appropriately as you vary the browser window size, as shown above). This is actually quite easy to do using Bootstrap.
You must use jQuery and Bootstrap to implement selection, event handling, styling, and responsiveness effects.
You can use any reasonable means of creating the chart, but the recommended (and very easy-to-use) JavaScript charting library is Chart.js (www.chartjs.org). It has built-in responsive behavior which you can enable.
You can also receive 10 points extra credit for implementing
Regular Expression filtering, and handling the Enter key along with the
Apply/Update button to update the display.
Test your program thoroughly! Be sure to test your application for various filter expressions. Make sure your implementation does not generate runtime errors.
When you have finished,
Your grade will be based on the following:
| Timeliness of submission (-10 pts/day if late) | |
| 75: Correct behavior/implementation of required functionality, as described above. | |
| 15: Appropriate commenting | |
| +5: Implementation of Regular Expressions | |
| +5: Implementation of handling the Enter key to have the same effect as pressing the Apply/Update button | |
| 10: Correct code/file structure and submission |