CSC 2210, SPA 2: Histograms
This assignment will give you experience with writing procedural programs with arrays in C++. The basic process is to implement pseudocode we are giving you. But do read the writeup carefully; there are several common mistakes that can lead to endless hours of debugging. NOTE: this is an individual assignment; the CSC/SWE academic integrity document applies in full. Minimize your use of GenAI so that you will be able to write similar code during exams.
As shown to the right, a
histogram 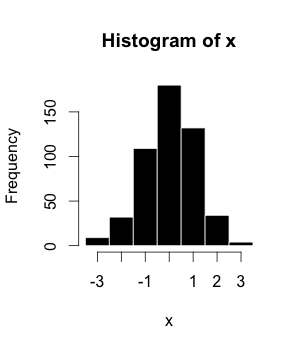 is a chart showing how frequently a particular value appears
in a data set. For this assignment, you will create a similar chart, though
in yours the frequency will be drawn across the x axis insteady of the
y axis. The input to the program will be nonnegative integers, and the
output will be an ASCII chart showing the frequencies of each item. The
axes will be labeled as described below. For example, if the input values
are
is a chart showing how frequently a particular value appears
in a data set. For this assignment, you will create a similar chart, though
in yours the frequency will be drawn across the x axis insteady of the
y axis. The input to the program will be nonnegative integers, and the
output will be an ASCII chart showing the frequencies of each item. The
axes will be labeled as described below. For example, if the input values
are
0 1 1 4 3 1 1 0
then the chart you will draw will be
             4 |#
             3 |#
             2 |
             1 |####
             0 |##
               +----+----+
               0    5    10
Note that # is being used to mark each value read from the list of
numbers, so the bottommost ## means there were two zeros in the input.
In addition to the actual values, the input will start with a specifier indicating the range of values to process. The first number is the lower limit, and the second is the upper limit. For example, if the lower limit is 5 and the upper is 10, then reading a 4 would result in printing
Error: value 4 is out of range
The program will always display all of the possible values from the lower to the upper limit. Thus the above chart would be generated by the full input
0 4 0 1 1 4 3 1 1 0
The 0 and the 4 represent the possible ranges, and the remaining numbers comprise the data. The input
        9 13
        12 9 9 12 9 11 14
would give the output
            Error: value 14 is out of range
             13 |
             12 |##
             11 |#
             10 |
              9 |###
                +----+----+
                0    5    10
A subtle thing to note is that numbers are right-justified in the first three columns. All ranges will be between 0 and 999, inclusive.
The above examples have fewer than ten values. If the input was twelve 5s,
5 5 5 5 5 5 5 5 5 5 5 5
(so the legal input range is 5 to 5) the chart would be
             5 |##########
               +----+----+
               0    5    10
If some input has a frequency greater than 10, extend the bottom axis to be the next greater multiple of ten. For example, if the input has thirty-two 2s (so first two specify the range is 2 to 2), you would display
         2 |##############################
           +----+----+----+----+----+----+
           0    5    10   15   20   25   30
Thirty-three 2s would have a bottom axis that extends out 40 places.
The minimum bottom axis is 10 places, so the input "0 0" would give
the chart
         0 |
           +----+----+
           0    5    10
Do not prompt for any of the data; just read the numbers from standard input and draw the chart on standard output. You can assume the first two inputs are nonnegative integers. You can also assume that the lower limit is no larger than the upper limit.
Design Requirements
Pseudocode is being provided for this assignment (see below); the basic goal of the assignment is to convert the pseudocode into C++ code. However, you are not required to use the pseudocode.
All solutions must satisfy the following constraints. Some but not all of these are captured in the pseudocode.
Writing functions is a critical part of this lab. The pseudocode makes suggestions, but you will need to write additional functions of your own. To force this, you must satisfy two requirements: that you have at least 4 functions (including
main, which is a function), and no function can have more than 15 lines of code. The 15-line limit includes blank lines; see the class coding standard.Each function must have a single, clear purpose. The name of the function should express a clear goal such as
drawHorizontalAxis. Do not mix computing results (say, the length of an axis) with printing results (say, displaying the axis). Just write a separate function for each.Use an array to count the number of times each number is read from the input. Allocate this array based on the maximum value to be charted (the second number). If the second number is 500, allocate the array so it holds 501 values (0 through 500). Note that the following is legal C++ code, though you would want to use a better variable name and add a check to make sure the number was not too large:
      int n;
      cin >> n;
      float nums[n];
Document each function. A line or two should be sufficient; you do not have to use a standard like javadoc. Capture responsiblities.
Your solution is to be procedural, not object-oriented. This means you should not write classes.
All variables must have minimal scope. In particular, do not declare any global variables. This does not apply to named constants; those typically should be global.
Do not use Standard Template Library containers such as
maporvector.All output must be generated using
coutand<<. That is, do not usestd::formatorprintfin your solution.It is traditional to write error messages to
cerr. This causes problems with esubmit. Write error messages tocoutalong with the other output.Do not use
sizeofin your solution. Use a separate variable to track the size of your array and pass that information through parameters.
Stage 1
You can receive 50% credit for this assignment by completing test
2, the example given above. For this input, you can write a
function to read the data (as described above) and implement the
longestRow and axisWidth functions to always return 10. That is,
the body of both would be simply
return 10;
Likewise, drawHorizontalAxis would simply write "----+----+"
and labelHorizontalAxis would write just the 0, 5, and the 10. Getting
this test to pass will go a long way to ensuring you have all of the
basic structure in place.
Stage 2
Complete the rest of the lab. You might start by getting longestRow
and axisWidth (or their equivalents) to return correct values,
implement drawHorizontalAxis, implement labelHorizontalAxis, and
then correct any remaining issues. If you run into segmentation fault
errors or other run-time issues, see the bottom of this writeup.
Hints
This section gives further hints for portions of this assignment. You do not have to follow these hints, but they might save you time.
See
distinct1000.cppfor sample code reading in integers and processing each. In particular, note howdistinct1000.cppcaptures whether or not the program reads any particular value. This assignment is very similar, but instead of capturing whether a number was read, it captures how many times that number was read. That is, thenumbers_foundarray can be replaced by an array of integers counting the number of appearances. For example, if item 33 in the array has a count of 3, this means you will print three hash marks for 33 in the resulting chart. Another difference is thatdistinct1000declares a fixed-sized array; for this assignment you are to use a size that you read from standard input.Remember arrays are passed by reference, but there is no size information. See
increasing-numbers-v2.cppfor code illustrating this.arr.cppillustrates declaring an array based on a size read from the user.assignment-pseudocode.txtgives hints about how you might want to structure your solution.The main program will read in the data, figure out what rows to print in the chart, and then print the histograms for each of those rows. At the end, it will figure the width of the widest row and use that information to print the x axis with labels.
Part of the assignment is formatting the output to match expectations. In case you missed it, the code
cout << setw(4) << x;will print x (say, an integer) in four spaces, adding leading blanks as needed to fill it out. If x takes more than four spaces, it will print the whole value. To usesetw, you need to have#include <iomanip>at the top of the program. By default,setwaligns values to the right; you can useleftandrightto control this. Alternatively, you could simply format the data for yourself by working how how many blanks to print.Sample inputs and outputs are available.
Submitting
- Submit your solution (as 2hist) using esubmit. You are expected to match this output exactly, though you can get partial credit if there are some errors.
- Ensure your code meets your instructor's coding standard, including the banner comment for the file. Remember there is a requirement above to document each function for this solution. Also note that compiling without warnings is also part of the coding standard.
- Ensure you have not used standard library classes like
listorvectorin your solution. Use simple arrays for this assignment. - If requested by your instructor, answer the reflection questions in Canvas.
Common Issues
- Refer to the notes for writing end-of-file controlled loops. Attempts to write the code with a single read statement are likely to give incorrect results.
- If you get a Segmentation fault, see Debugging 201: Debugging Segmentation faults in C++ Programs.