To open CSV file in excel, double-click on it in explorer
Please electronically edit and upload the Word Template for the lab report. Feel free to unlock the document so you can edit outside the forms. But please be sure to put all of your text for each required section into the form field if you do unlock it.
You may find the A chart of the SI multiples for seconds handy
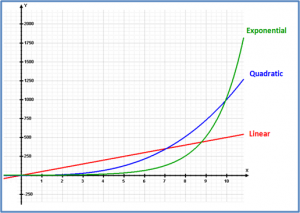
Also, remember that Quadratic and Exponential look a lot alike, but exponential will have much more growth in the long run.
Submission Instructions for Dr. Yoder
Submission (Due week 2 Tuesday, 11pm)
Fill in the Lab 1 Report Template, being sure to fill in:
- All of the required plots
- Your name, date, assignment name
- The required discussion
- Professionally-formatted figures:
- Descriptive titles (labels) on each axis, including units unless unitless (in which case you only need the description)
- Figure captions, in the form Fig X: Description These are already filled in with default values. You can leave the helper text if you want.
- References to the figures from your discussion text, e.g. "Fig. 2 demonstrates that the ArrayList performs the add-at-end method faster/slower than the LinkedList. This could be because..."
- As mentiond in lab, don't have Excel draw lines between the points on your figures. Let each dot stand on its own. (This is a long-standing tradition in scientific publications; it emphasizes that each measurement is somewhat independent.)
Dr. Taylor has written two short videos (combined length: 17 minutes) that describe how ArrayList and LinkedList work. You are welcome to watch these videos and update your report before submitting it.
(Acknowledgment: original written by Dr. Taylor)